Netflow and Kentik Network Observability
Introduction
In this article we talk about a network protocol called Netflow, which provides monitoring platforms with meta data about network traffic. We'll also look at some Python code that can generate Netflow, and so see how it's possible to integrate Netflow with applications or systems that don't normally have it.
We also take a brief look at the Kentik Network Observability Platform and talk about some of the key points we learned by using it (and making our Netflow work with it).
What is Netflow?
Netflow is a simple network protocol used by various network devices to provide usage and volumetric information to monitoring platforms. For example, it might be used by a network device to say "I have transferred 1 megabyte of data in 1000 packets from A to B".
Netflow can 'wrap' multiple packets into a single message so that you don't end up with a situation where you're sending a network packet about every packet that you've handled.
Netflow was developed by Cisco as a way to monitor their networking devices, but actually you can use Netflow for anything related to network traffic. This way you can provide rich information to monitoring platforms that goes into much more detail than simple network interface usage counters. You can probably imagine a device in a monitoring tool that says its network interface is running at 500Mbits/s, but then being able to "drill down" to see which other devices are using it the most, and even which protocols they're using to do so (when we say "protocols", we really mean "port numbers"). Netflow makes the "drill down" possible.
In technical terms, the Netflow protocol is quite flexible. However, as with all such things, some conventions exist so much of the flexibility and options aren't used all that much. A common example of a Netflow message might contain:
- Source IP address (IPv4 or IPv6 are supported)
- Destination IP address
- Port number
- Bytes transfered
- Number of packets sent
- The ID of the network interface used to transfer these packets
Fields are optional, so not all fields need to be included. Netflow V9 uses a "template" mechanism to say which fields are included in the message.
Something to note is the "ID of the network interface" field. This doesn't have
to be included, but monitoring platforms will use this information to attribute
Netflow with "devices" they are monitoring. Where its used/needed, it has to be
the same numeric ID number as the monitoring platform is expecting. If your
device has a network interface called eth1, then somewhere in the monitoring
platform there'll be a device with an interface called eth1. It'll have some
numeric ID number, and the Netflow being produced needs to match this number.
Monitoring platforms like to auto-configure themselves, which they typically do using some sort of 'network discovery' mechanism. SNMP is extremely common for this purpose, and the 'device ID' that SNMP uses is likely the device ID required for Netflow. Indeed, the template calls this field "INPUT_SNMP" or "OUTPUT_SNMP".
For Linux users, the output of ip a gives you the ID numbers you need. For
example:
1: lo: <LOOPBACK,UP,LOWER_UP> mtu 65536 qdisc noqueue state UNKNOWN group default qlen 1000
    link/loopback 00:00:00:00:00:00 brd 00:00:00:00:00:00
    inet 127.0.0.1/8 scope host lo
       valid_lft forever preferred_lft forever
    inet6 ::1/128 scope host noprefixroute
       valid_lft forever preferred_lft forever
2: eth0: <NO-CARRIER,BROADCAST,MULTICAST,UP> mtu 1500 qdisc mq state DOWN group default qlen 1000
    link/ether d8:3a:dd:30:5d:8b brd ff:ff:ff:ff:ff:ff
3: eth1: <BROADCAST,MULTICAST,UP,LOWER_UP> mtu 1500 qdisc state UP group default qlen 1000
    link/ether d8:3a:dd:30:5d:8c brd ff:ff:ff:ff:ff:ff
    inet 192.168.23.45/24 brd 192.168.23.255 scope global dynamic noprefixroute wlan0
       valid_lft 55304sec preferred_lft 55304sec
Here, the number in the very left hand column is the ID number (eg. eth0 has ID 2).
To generate some actual Netflow messages in Python, the helpful scapy library
can do all the hard work. For example:
import scapy.layers.netflow as nf
import scapy.layers as sl
import scapy.layers.l2 as l2
import scapy.layers.inet as sinet
import ipaddress
import socket

# Define the 'template', which outlines which fields we'll be sending
# when we send Netflow messages
flowset = nf.NetflowFlowsetV9(
    templates=[nf.NetflowTemplateV9(
        template_fields=[
            nf.NetflowTemplateFieldV9(fieldType="IN_BYTES", fieldLength=4),
            nf.NetflowTemplateFieldV9(fieldType="IN_PKTS", fieldLength=4),
            nf.NetflowTemplateFieldV9(fieldType="OUT_BYTES", fieldLength=4),
            nf.NetflowTemplateFieldV9(fieldType="OUT_PKTS", fieldLength=4),
            nf.NetflowTemplateFieldV9(fieldType="PROTOCOL"),
            nf.NetflowTemplateFieldV9(fieldType="IPV4_SRC_ADDR"),
            nf.NetflowTemplateFieldV9(fieldType="IPV4_DST_ADDR"),
            nf.NetflowTemplateFieldV9(fieldType="INPUT_SNMP"),
            nf.NetflowTemplateFieldV9(fieldType="OUTPUT_SNMP"),
        ],
        templateID=256,
        fieldCount=9)
    ],
    flowSetID=0
)
netflow_header = nf.NetflowHeader()/nf.NetflowHeaderV9()
recordClass = nf.GetNetflowRecordV9(flowset)

# These values would normally come from whatever you're monitoring ;-)
# As an example, we'll just set them statically for now.
in_bytes = 754
in_pkts = 5
out_bytes = 267
out_pkts = 1

# These are the "SNMP IDs" of each interface. See `ip a` for details
if_ids = {
  'lo': 1,
  'eth0': 2,
  'eth2': 3,
}

# Now construct a Netflow record. Note that the integers have to be 'big endian'
# and packed into byte fields with the same length as defined in the template.
netflow_record = recordClass(
    IN_BYTES=in_bytes.to_bytes(4, 'big'),
    IN_PKTS=in_pkts.to_bytes(4, 'big'),
    OUT_BYTES=out_bytes.to_bytes(4, 'big'),
    OUT_PKTS=out_pkts.to_bytes(4, 'big'),
    PROTOCOL=4,
    IPV4_SRC_ADDR="192.168.23.37",
    IPV4_DST_ADDR="192.168.24.232",
    INPUT_SNMP=if_ids['eth1'].to_bytes(2,'big'),
    OUTPUT_SNMP=if_ids['eth0'].to_bytes(2,'big'),
)

# Now construct an actual Netflow packet. This does not include the IP/UDP
# components
dataFS = nf.NetflowDataflowsetV9(templateID=256, records=[netflow_record])
pkt = netflow_header / flowset / dataFS

# `pkt` contains the bytes we now need to send to a monitoring platform
# (usually via UDP, although TCP is often possible too)
Once the packet has been constructed, it can be sent to a monitoring platform
using the Python socket library (which will add the IP/UDP components to
the packet as it travels across the network). We won't get into it too deeply
here, but something like this will do it:
sock = socket.socket(socket.AF_INET, socket.SOCK_DGRAM)
sock.sendto(bytes(pkt), (netflow_server, netflow_port))
Once you've got some basic Netflow running, it's not much to start to produce Netflow for things that don't normally have it. It gets pretty cool when your webservers suddenly start producing Netflow and your Networks team can start to 'drill down' into what's going on with the network and even the applications that run on it.
Kentik Network Observability
There are free trials available of the Kentik platform, which we used to get our Netflow working, and also to demonstrate a "mesh" of devices and how they talk to each other. We produced something like this picture (although ours was a lot smaller):
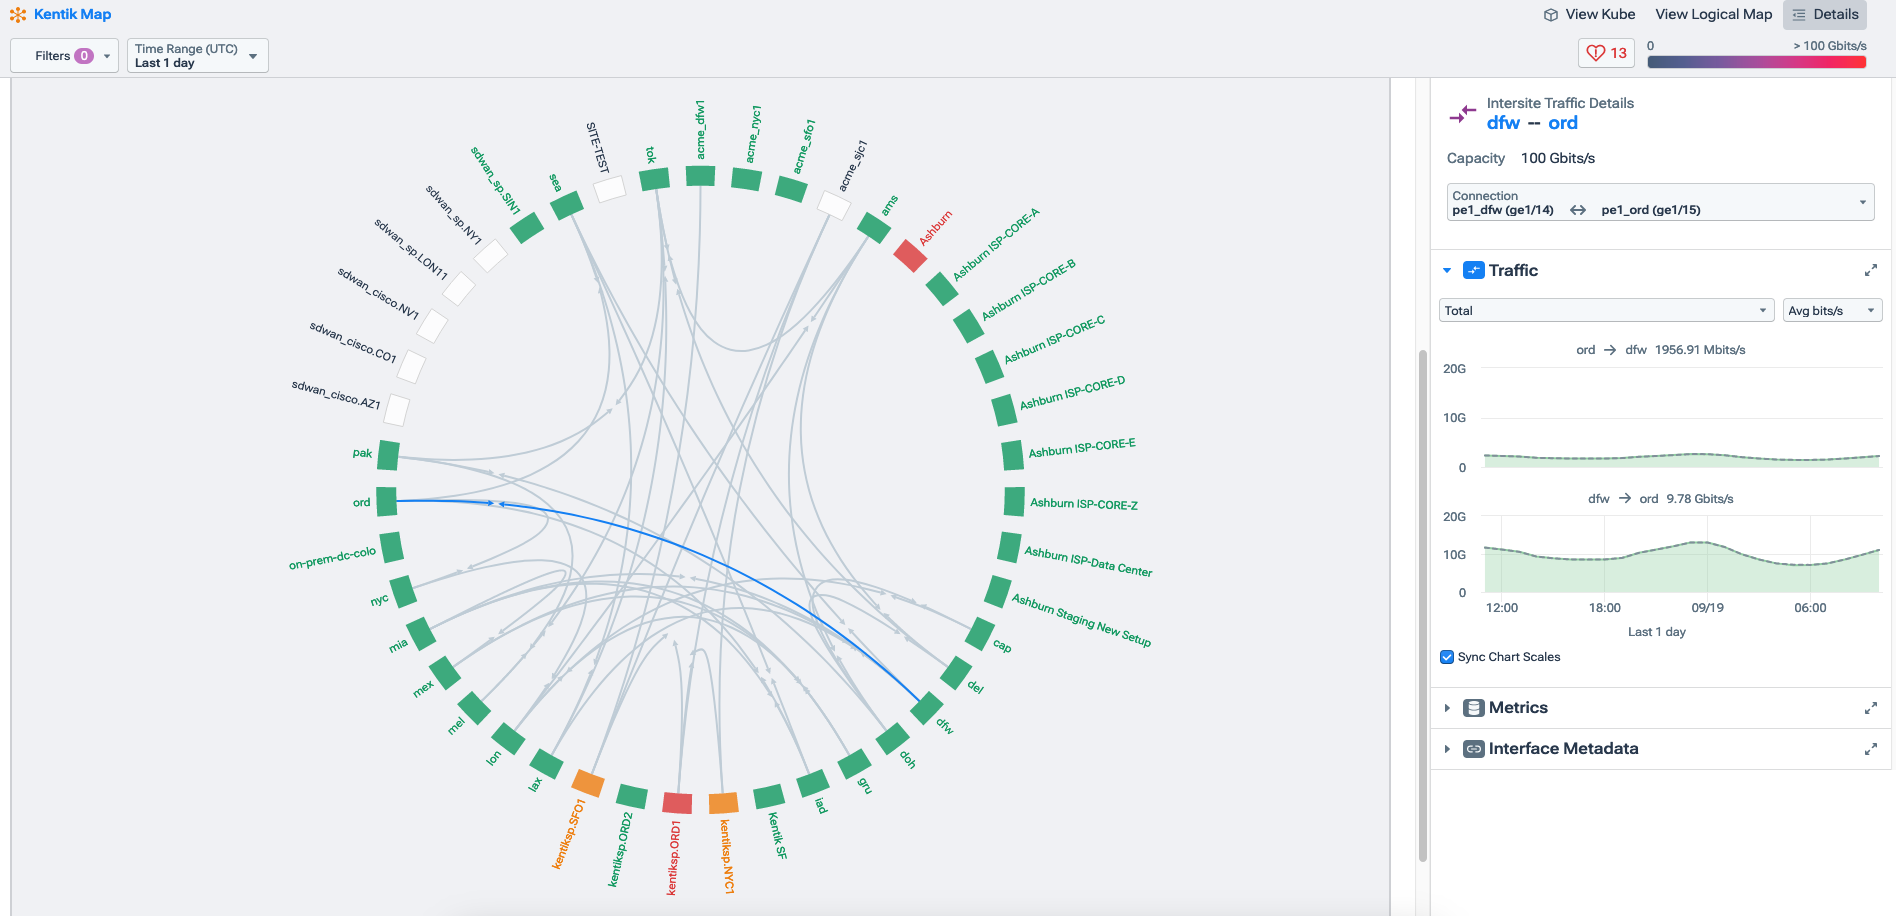
As a side-note, we had a great experience with Kentik and their lovely people. We had a fairly atypical use-case, but everyone we spoke to was keen to get us up and working, and for us to get the most out of their platform that we could.
The main things we learned by using the Kentik platform were:
- To get a device to show Netflow, it has to be 'assigned' to a network interface connected to the device. For this to work, the interface IDs in Kentik and in the Netflow have to match (we've talked about this quite a bit above).
- Kentik likes to use SNMP as a means to discover devices and network interfaces. It is possible to do all of this manually, but SNMP is definitely quicker on any sort of sizeable estate.
- Kentik has a 'proxy' daemon available which can consume Netflow and send it on to the platform via TLS-encrypted means. This isn't mandatory, but it works quite well, and is largely controlled by the configuration of the platform itself.
- Small networks are a bit less interesting to look at than big and busy ones(!) If you're putting together some sort of demo, then think about making devices talk to each other 'randomly' and to use differing amounts of traffic when they do so. Running some 'pings' from time to time doesn't make for much to look at ;-)
Our other main learning was just how much information platforms like Kentik are able to surface about the networks they monitor. Even our relatively simple network was very ably exposed by Kentik, and so we really could see an awful lot of what was going on there, in a variety of different contexts. This seems like a great return on a relatively small amount of setup that's required.
We didn't use either, but we note that Kentik has a REST API and there are also Terraform providers for it. That suggests it might be possible to provision servers and whatnot in a cloud environment AND update Kentik with the same information immediately. That would reduce any manual work required and would ensure Kentik stays up to date, even as virtual infrastructure changes.
Conclusions
Netflow is a relatively simple protocol for providing network monitoring and
observability tools with meta data about network traffic flowing through devices.
It's pretty easy to generate some Netflow, and we've demonstrated this using
the scapy Python library.
The likes of the Kentik Network Observability Platform work well with Netflow data, but there is some interconnection between the platform, the Netflow and the physical device generating it. Once resolved though, Kentik is able to show a great deal of information in different forms, for a relatively small amount of setup.
For any help with Netflow, or getting yourself setup for maximum Observability (with Kentik or indeed anyone else), please contact us - we can help you figure out what you need and make it work for you.